Soybeans: A Strategic Commodity Shaped by China and Brazil and Influencing Global Food and Energy Prices

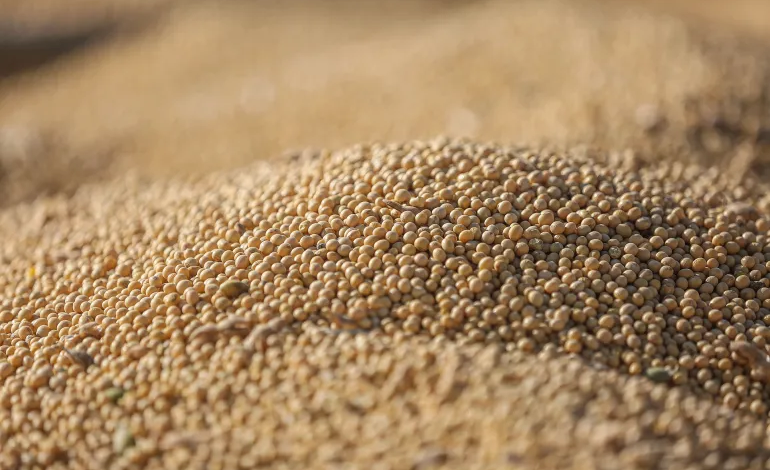
Soybeans have a major influence across key sectors of the global economy, food industry, and energy markets. They are widely used in poultry, livestock, fish and shrimp feed, cooking oils, plant-based foods, and biodiesel production.
Because of this broad range of uses, any change in China’s purchases, Brazil’s production, or tariff policies between the United States and China can affect feed, meat, poultry, and food prices in markets far from the world’s main production and consumption centers.


According to September 2026 estimates from the U.S. Department of Agriculture, global soybean production is expected to reach approximately 442.35 million tons in the 2026/2027 season, while soybean crushing could reach 385.22 million tons. Global soybean trade is projected at around 191.58 million tons.
A Huge but Highly Concentrated Market
These figures highlight the enormous scale of the global soybean market, but production and exports remain heavily concentrated in a small number of countries, particularly Brazil, the United States, and Argentina, while China dominates the demand side.
Global exports of raw soybeans were valued at approximately $80.5 billion, while soybean meal exports reached about $34.8 billion and soybean oil exports approximately $13.5 billion. Combined, these major soybean products represented around $128.8 billion in international trade, excluding the food and animal products that subsequently depend on them.
The market, however, is not driven by supply and demand alone. Trade relations between the United States and China have increasingly reshaped global soybean flows.
China Redirects Its Purchases
China maintained an additional 10% retaliatory tariff on U.S. soybeans this year, encouraging Chinese importers to turn toward alternative suppliers in South America, particularly Brazil.
At the same time, Chinese state-linked companies continued purchasing U.S. soybeans. By mid-September 2026, Chinese bookings of U.S. soybeans for the 2026/2027 season had reached approximately 8.98 million tons.
This has made the soybean market highly sensitive to changes in trade relations between Washington and Beijing. When Chinese purchases from the United States decline, Brazilian supplies become more attractive, while U.S. farmers and exporters benefit when Chinese demand returns.
The World’s 10 Largest Soybean Producers
The latest available data for 2024 shows that global soybean production is heavily concentrated among a handful of countries. The largest producers were:
- Brazil: 144.5 million tons, accounting for about 36% of global production.
- United States: 118.8 million tons, or around 30%.
- Argentina: 48.2 million tons, or approximately 12%.
- China: 20.7 million tons.
- India: 15.1 million tons.
- Paraguay: 11.1 million tons.
- Canada: 7.6 million tons.
- Russia: 7 million tons.
- Ukraine: 6.6 million tons.
- Bolivia: 3.2 million tons.
Actual global soybean production reached approximately 397.7 million tons in 2024, with the top five producers accounting for nearly 87% of the world’s total crop, highlighting the high concentration of global supply.
According to USDA projections for the 2026/2027 season, production in the three largest producing countries is expected to rise to around 186 million tons in Brazil, 123.42 million tons in the United States, and 50 million tons in Argentina.
Brazil Leads Global Soybean Exports
International trade data for 2024 highlights the dominance of Brazil and the United States in raw soybean exports. The leading exporters by value were:
- Brazil: $42.94 billion.
- United States: $24.57 billion, with 52.33 million tons exported.
- Paraguay: $3.17 billion, with 7.99 million tons.
- Canada: $2.49 billion, with 5.13 million tons.
- Argentina: $1.81 billion, with 4.15 million tons.
- Ukraine: $1.34 billion, with 3.43 million tons.
- Uruguay: $1.21 billion, with 2.81 million tons.
- Netherlands: $232.9 million, with 451,700 tons.
- Croatia: $119 million, with 237,700 tons.
- Nigeria: $118 million, with 472,000 tons.
Brazil and the United States together generated approximately $67.5 billion in soybean exports in 2024, representing around 86.6% of the combined export value of the top 10 exporters.
This dominance explains why agricultural production in Brazil and changes in U.S.-China trade relations can have such a significant impact on global soybean prices, shipping routes, and trade flows.
China Dominates Global Imports
China occupies a unique position in the global soybean market, importing approximately 105.03 million tons of raw soybeans in 2024, far more than any other country.
The largest importers after China were:
- China: 105.03 million tons.
- Argentina: 7.58 million tons.
- Mexico: approximately 5.3 million tons.
- Thailand: 3.87 million tons.
- Turkey: 3.75 million tons.
- Spain: 3.69 million tons.
- Germany: 3.64 million tons.
- Egypt: 3.44 million tons.
- Japan: 3.17 million tons.
- Indonesia: 2.68 million tons.
China accounts for roughly 60% of global raw soybean trade, making purchasing decisions by Chinese companies and importers a major factor in determining market trends, oilseed prices, and shipping costs.
10 Major Industries That Depend on Soybeans
The importance of soybeans extends far beyond agricultural trade. The crop supports a wide range of industries and products, including:
- Poultry feed.
- Livestock feed.
- Fish and shrimp feed for aquaculture.
- Household and commercial cooking oils.
- Margarine and edible fats.
- Sauces, fermented products, soy milk, and tofu.
- Plant-based meat alternatives.
- Plant-based dairy alternatives.
- Biodiesel and renewable fuels.
- Chemical products such as inks, paints, adhesives, lubricants, and other bio-based industrial products.
The biofuel sector is becoming increasingly important for the soybean market. USDA projections indicate that U.S. soybean oil use for biofuel production could rise to 17.8 billion pounds in the 2026/2027 season, compared with approximately 14.8 billion pounds in the previous season.
10 Factors Driving Soybean Market Growth
Global soybean demand is being supported by several interconnected factors, including:
- Rising global poultry consumption.
- Growing demand for animal protein.
- Expansion of aquaculture and the use of compound feed.
- Increasing demand for edible vegetable oils.
- Expansion of biodiesel and renewable fuel production.
- Growing soybean crushing capacity in China, Brazil, the United States, and Argentina.
- Agricultural expansion and improved yields in Brazil.
- Rising demand for plant-based foods.
- Growth in the alternative protein market.
- Chinese trade policies and purchasing decisions that can quickly shift demand between U.S. and Brazilian supplies.
The USDA expects global soybean crushing to reach a record approximately 385.22 million tons in the 2026/2027 season, reflecting continued growth in food and industrial demand.
10 Risks Facing the Soybean Market
Despite expectations for continued production and consumption growth, the soybean market faces several risks that could affect prices and supply chains:
- Drought and extreme heat during flowering and pod-filling stages.
- Heavy rainfall, flooding, and delays in harvesting and shipping.
- The impact of El Niño and La Niña on agricultural production in South America and the United States.
- Escalating tariffs between the United States and China.
- China shifting more purchases toward Brazil at the expense of U.S. suppliers.
- Higher fertilizer, energy, and maritime transportation costs.
- Disruptions at ports, roads, and rivers in South America.
- Declining soybean crushing margins in China, potentially weakening demand.
- Changes in biofuel policies and environmental support programs.
- Stricter environmental requirements and supply-chain traceability rules related to deforestation.
Continued trade tensions between Washington and Beijing could strengthen Brazil’s position as a competitive supplier to China, even if some Chinese purchases return to the United States.
Egypt Leads Arab Soybean Production
Arab soybean production remains small compared with output from Brazil, the United States, and Argentina, while the availability and recency of production data vary from one Arab country to another.
Egypt stands out as the leading Arab producer for which recent production data is available, with output reaching approximately 75,000 tons in 2024. This remains extremely small compared with the country’s import requirements, which exceed 3 million tons of soybeans annually.
The leading Arab importers of raw soybeans in 2024 were:
- Egypt: 3.44 million tons, worth approximately $1.99 billion.
- Algeria: 1.26 million tons, worth about $738 million.
- Saudi Arabia: 391,000 tons, worth $196 million.
- Tunisia: 343,000 tons, worth $201 million.
- Lebanon: approximately 76,000 tons.
These figures highlight the dependence of several Arab countries on the global soybean market to meet their needs, either through imports of raw beans or processed soybean products. This leaves Arab markets exposed to changes in global production, shipping costs, and trade policies among the world’s largest producers and consumers.